I’ve been sampling terracotta pieces with microCT recently. This is the same CT scanning technology that is used in medicine, the one that gives you x-ray slices down the body. This is the same, and just like the human body, it’s a bit opaque as a volume, so we will mostly be looking at slices. (part 2, if you’re looking for the followup)
The way the machine I’m using works is that the sample is mounted on a 30mm wide disc, and a series of x-ray slices are taken through it as it slowly rotates. This pattern is then ‘solved’ for the most likely pattern of density, with, just like x-rays, the pixels being shown as brighter the denser they are. It’s worth remembering that each pixel is actually a voxel, and has neighbors above and below the slice as well as next to it. Each pixel in the image below was roughly 9 microns, 0.009mm in each dimension. They’ve been emailed, downloaded and re-uploaded to here, so goodness knows what compression algorithms have done to them.
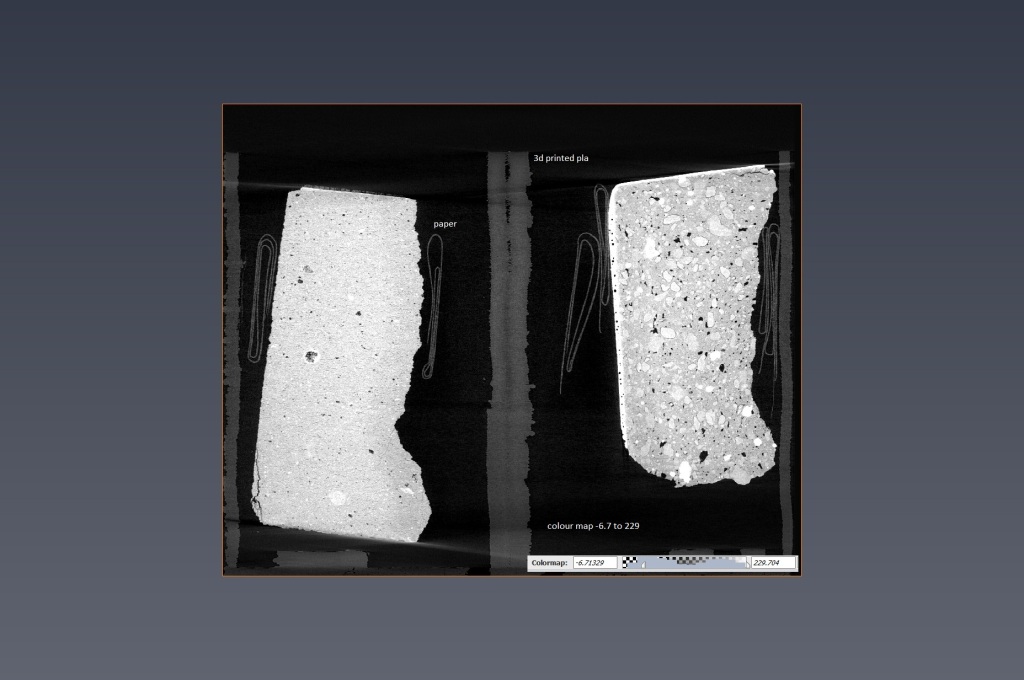
This image shows a slice through the holder I’m using to scan multiple samples at a time. Each layer in the 3d printed part is 0.2mm. the left hand sample is roughly 8mm thick. I’m using a 3d printed holder because it’s convenient to make and is just dense enough to show up, without really shadowing the samples. If I was working with softer things, that wouldn’t be true. Dense enough to show up is handy as I can label the samples with embossed a,b,c,d and those show up, which is handy while working with the model. The other odd thing clearly visible in the scan are some folded pieces of paper I used to jam the samples in the holder. I chose paper for the same reasons – low density and convenient. The parts are being rotated, and even a tiny wobble will ruin most of the scan, exactly like motion blur on a camera.
I’m scanning 4 samples at a time as they easily fit into the 30mm minimum area, while leaving enough clear space between them to be easy to cut into separate volumes of data later. I could scan a single large sample, but wouldn’t get that much more information, would have to wait for (and pay for) many more scans and keeping the files small and efficient pays off.

The relative density values can be seen in the little histogram on the bottom right of the image. I’ve cut the entire left ‘bump’ off the bottom of the grey scale, and all of the pla and paper has gone. The histogram is of the volume, and it’s perhaps possible there are equal number of voxels of PLA and paper to the four little samples of terracotta in the holder. It’s likely I’ve accidentally turned a few of low density voxels, the long tail, in the terracotta off. Why would that voxel be low density? Well, maybe it’s on the edge and is only half full. Maybe its in the middle, and has a pore running through it, with diameter 80% of the voxel side. That too would be a grey voxel of half the normal density.
It’s nice that we’re fitting relative density values of between 100 and 230ish to the Image. The white pixel only has display options between 0 and 256 as integers, so it’s nice we are not loosing too much resolution going to images and python.
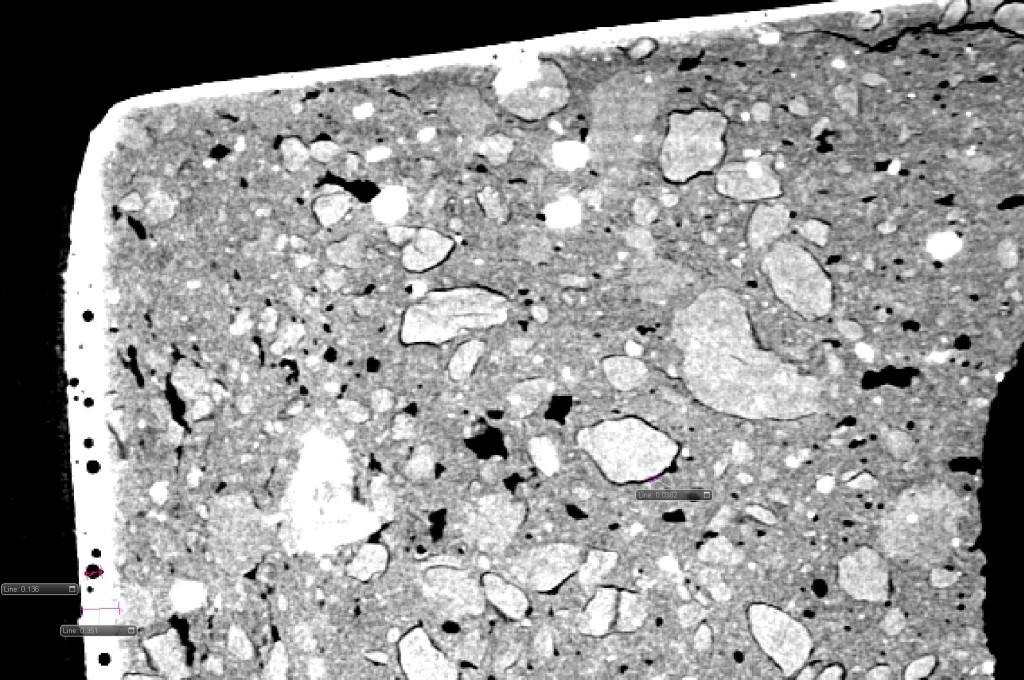
Looking at the glazed terracotta piece, we can see a few things. The glaze is white, it’s one of the densest things in the scan. If it was a pure silica melt (amorphous silica glassy phase), this would be very strange, as it is less dense than all the other things we would expect in the body (2.2 vs roughly 2.5~2.65 for quartz and christobalite, 3.2 for mullite, 3.92 for alumina ect). It should be darker than most of the body, not pure white. It is possible that the difference is purely driven by sub voxel porosity, but it’s more likely, being heritage terracotta, it’s a lead based glaze (4.0 to 5.9). Don’t inhale!
If that’s the case, the smaller white grains in the body are possibly iron oxides, the larger pale grey grains may be a well fired dense ceramic crank consisting of mostly mullite and alumina, and the darker grey grains might be quartz sand or previously fired porous terracotta crank. The matrix between them all is darker grey with porosity – we shall see that the roof tile fragment is composed of the same materials, but looks brighter due to higher overall density.
The larger grains often have an thin air film where they have pulled away from the matrix during cooling. The ratio of the diameter of the grains + gap to the grain alone should give the percentage dimension change from peak firing to cool. If the grain material is known, that should give us the peak firing temperature for that grain. The peak temperature may vary with depth into the body, so three data points for each measurement are needed – the two diameters and the estimated distance to the nearest surface.
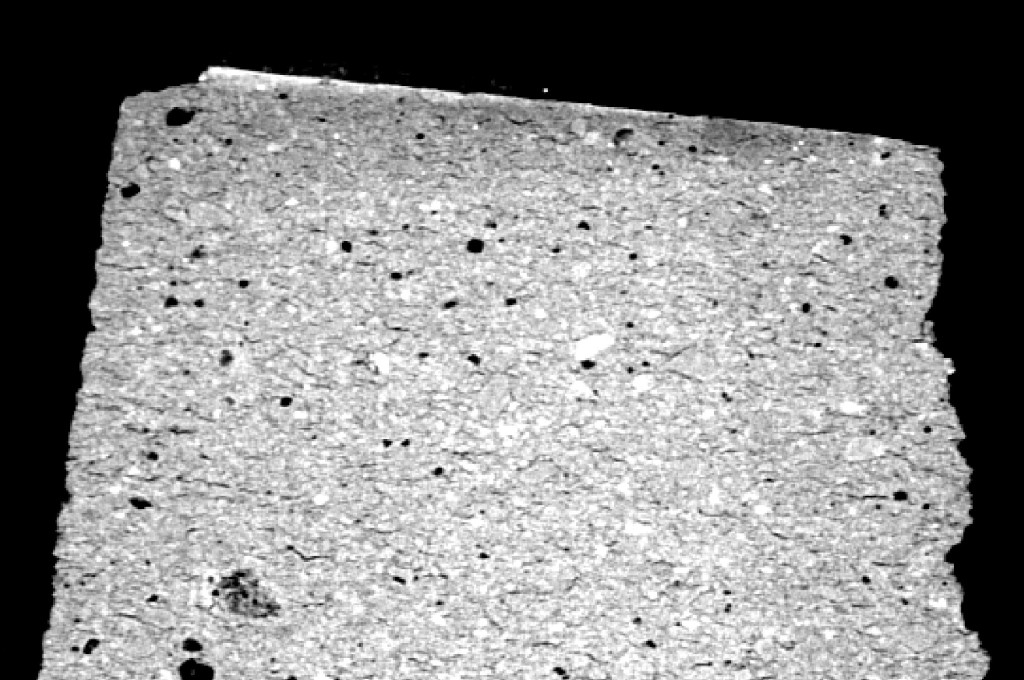
The tile, by contrast, shows much higher consistency and density across the sample. Some small grains are dimly visible, but nothing as exciting as the glazed terracotta. There’s some small round bubbles and faint evidence of chimneys or laminar cracks running parallel to the surface. Which they are can be checked by moving the CTslice up and down a little. It is possible to resample this on a smaller white to black setting to make the grains clearer.
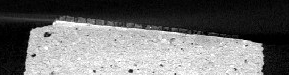
The weathered surface at the top of the tile has been largely hidden during the first tuning to hide the PLA holder (see below), but in the material we are seeing a slight greying of the body towards the surface with a very thin white layer at the very surface. The greying could represent an element in the matrix swapping out for a lighter one, but remembering it’s a heavily exposed roof tile, my hunch is that it is greyer because it’s more porous, rainwater and lichens leaching material from the top mm of the tile. The very thin white layer, with a similar density to the lead glaze, is not consistent across the surface. There’s a small chance it’s a concentration of iron oxides from the tile, or a concentration of atmospheric pollutants absorbed and rejected by the lichens ( paper 1 , paper 2, paper 3), but I have a feeling it may simply represent a calculation error from rebuilding the rotating scan.
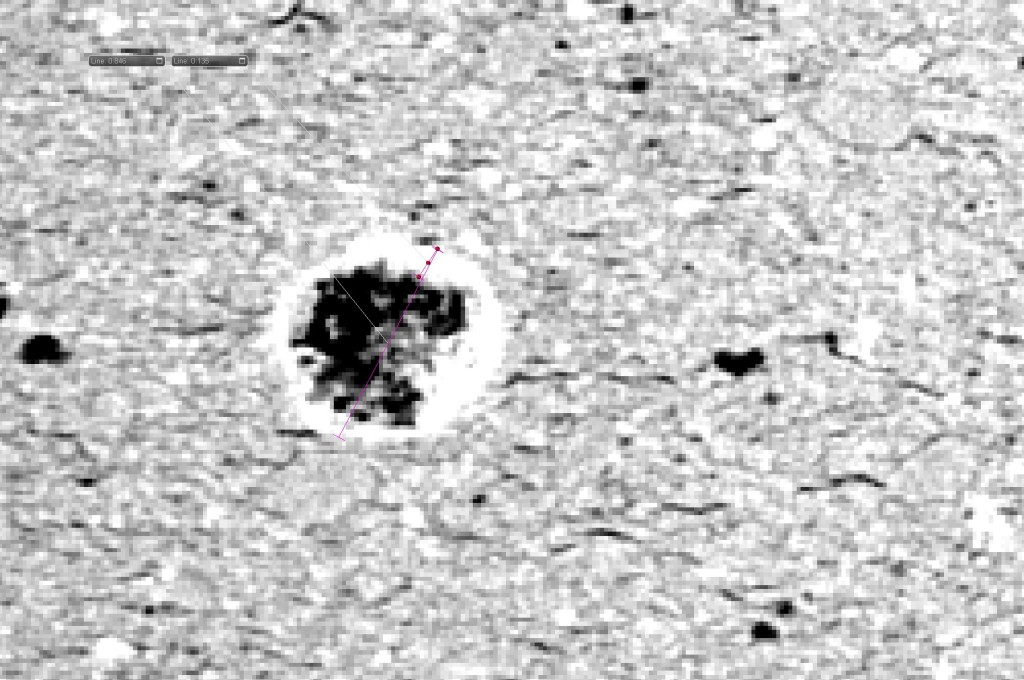
Finally, a quick view, very zoomed in, of the only major void in the roof tile with ‘something’ going on inside. Answers and guesses in the comments please!

Leave a comment